Explore & Make Sense of Your Data
Explot lets you gain insights through data. Quickly visualize your csv files and answer your data questions by exploring them in a safe enviroment.

- ✓ Free for 14 days
- ✓ Cancel anytime
- ✓ Money back guaranteed
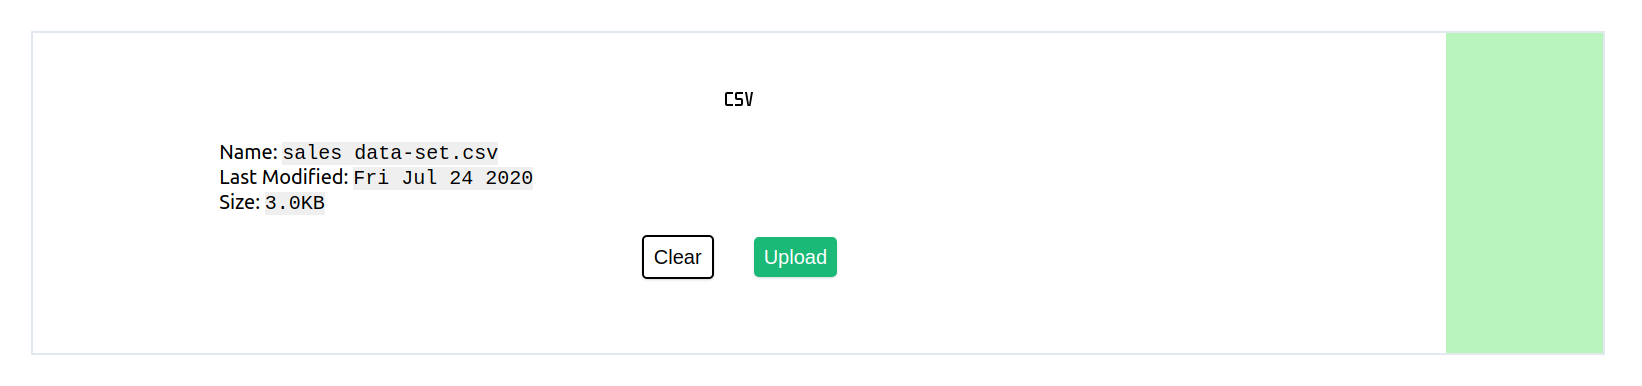
Step 1
Upload a file that you want to explore and visualize.
Step 2
View the data in table format and select a chart type.
Step 3
Select the data you want to visualize and how you want to aggregate it.
Step 4
View your chart.
Bonus
Create multiple charts side by side.
How To Get Started
Benefits
Spend time where it matters
Instead of spending time wrestling out data pipelines, SQL queries or chart dimensions, focus on viewing the data.
Gather the data in one place
Explot doesn't care where your file comes from as long as you can export or save them as csv. You can view all your files in one place and compare how they affect each other.
Simple interface
Explot doesn't clutter your screen with fluff data. So you can focus on the data that is core to the goal.
Focus on data questions
Explot doesn't save or override the files you upload any changes you make are in explot only. Letting you focus on experimenting and finding insights.
Start Your 14-Day Trial
All you need to get started is one csv file and some questions you want answered.